
The Digital Fingerprint of The Photo
In all the years I’ve practiced digital photography I’ve heard many photographers discuss histograms. Some will tell you, “a perfect histogram displays a nice bell curve” and still other photographers will say, “it needs to look like a nice mountain range across the LCD display.” But my all-time favorite that I’ve often heard at my photography workshops is “that’s a bad histogram” to which I reply with, “histograms don’t lie in photography, they’re all correct, regardless if your exposure isn’t.”

In this high-key photo you can see there is more data in the highlights side of the histogram.
There are no bad histograms, only bad exposures.Every histogram is perfect because a histogram is a graphical representation of the photo’s pixel intensity values that you’ve captured — the digital fingerprint of the image. Histograms don’t have to look horizontally even from end to end the first time you view them on the LCD monitor of your digital camera, nor do they need to look like sine waves or mountain ranges either. Histograms don’t lie in photography, they tell the truth and there’s nothing better than the truth if you want to improve your photography.
It’s important to remember that a histogram is a direct representation of what you as a photographer have captured based on the total number of pixels at different intensity values of the RGB color scale. Histograms include all that pixel information whether the exposure is correct or incorrect, so the graphical scale itself varies from photo to photo. The odds of finding identical matching histograms are no different than the odds of finding two identical snowflakes. The “key” or legend of a histogram is that the shadows are on the left and highlights on the right with middle tones in the center.
Histograms help you verify your image detail in the highlights and the shadows are exposed correctly along with the mid-tones. Histograms don’t lie in photography. Think of histograms to a photographer like sheet music to a musician. In photography, histograms display the “musical notes” of your photo, or the harmony in the tonal range between the shadows, middle tones and highlights.
The key to histograms is the ability to understand them in relation to what you try to capture with your digital camera. For example, if you’re in studio shooting a high-key set, then your histogram is going to show more information on the right or highlightsideof the graph. If you’re shooting a low-key set, then the shift is to the left of the histogram, or shadowside. Study how histograms match your scenes.
If your captured scene is correctly exposed with an even tonal range throughout the middle tones, shadows and back to highlights, you will have that mountain bell curve on your histogram scale. It’s important for photographers to understand what histograms tell them. The histogram display is a tool you can master by simply paying attention to what the digital graph looks like for a given scene. When you view your photo, look at the skin colors, colors in general, shadows, and highlights and then back at the histogram scale and compare the two.
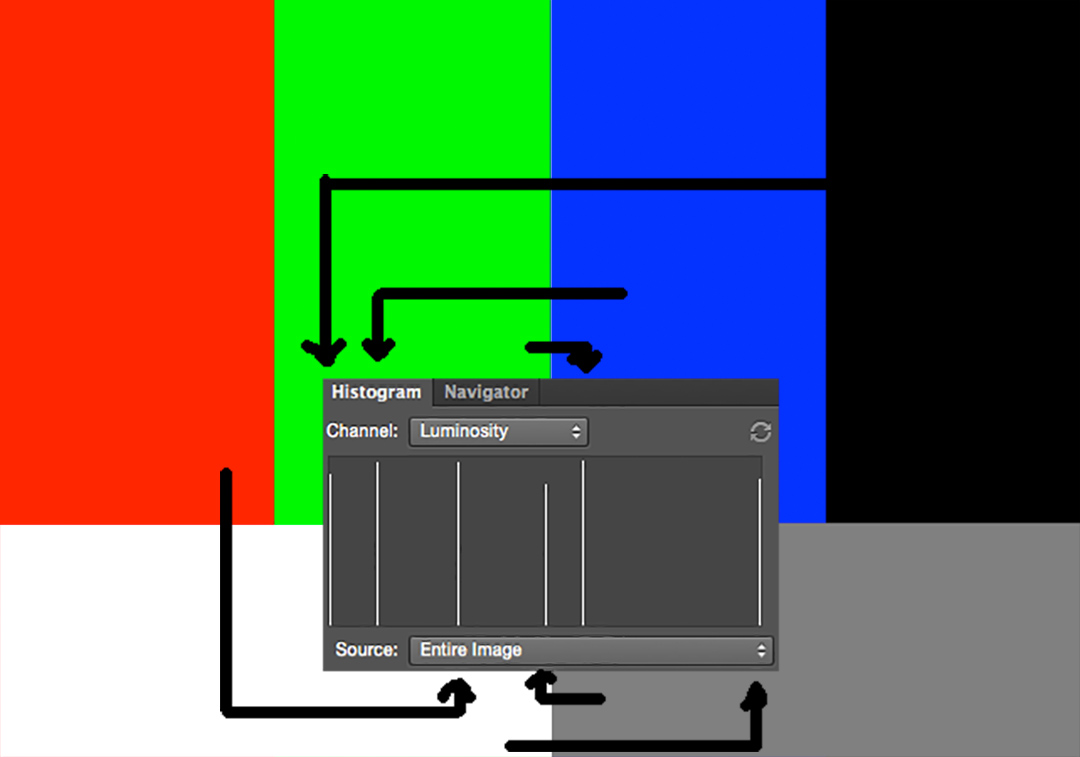
This photo has pure red, blue, green, black, white and gray areas, thus the histogram displays six straight lines vs. a mountain range from left to right. Notice how the histogram will represent, shadows to highlights from black, to blue, to red, to gray, to green, to white in a left to right form based on luminosity.
Pretend for a minute you captured an outdoor scene of the mountains with trees, shrubs, and in the colorful season of Spring. Then seven months later you go to that same spot, same camera, same camera settings based on the Sunny 16 Rule, and after you take the picture your histogram is more to the right side then the one from the Spring photo. Why is this? Well first of all the spring colors are gone and most of the vegetation is covered with snow. Snow is the main highlight in your histogram.
The main fundamental a photographer should focus on is to study how properly exposed images are displayed in the histogram.
Take the two photos in this article. The first one, is high-key, so naturally if the exposure is correct, most of the graphical data will shift the histogram to the right side or highlight side. Histograms don’t lie in photography. If the data shifts more to the shadow side, or left, then the photo would be judged as underexposed — for that photo.
The third photo, below, is a low-key image so the data is displayed to the left, or shadow side, when properly exposed. If the histogram has more data toward the highlights, or right side, then the that specific image is judged as overexposed and you would make the proper adjustments to correct the exposure until the data more accurately represents the scene, in this case, more blacks than whites.
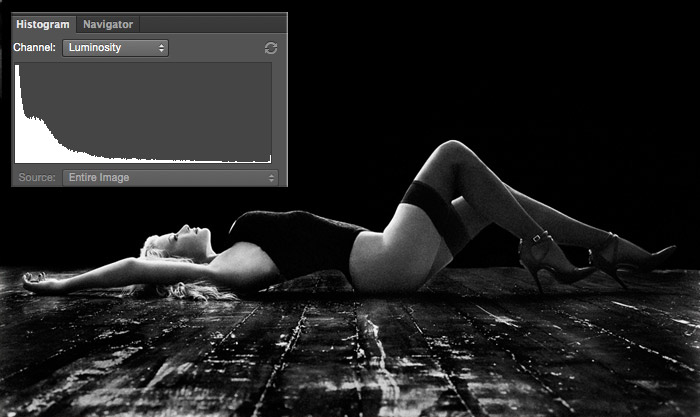
Notice how the blacks are represented on the left side of the histogram.
If you master histograms you will master your photography. Remember, it isn’t about bell curves or mountain ranges, it’s about you must strive to get it right in the camera. Histograms will help you do that if you take the time to understand that histograms don’t lie in photography, they are in fact the digital fingerprint of the image.